Power Query - How to's
In this page you will find a range of useful activities to achieve more with Power Query.
Contents
Expanding JSON objects in a table (nested data like Classification Codes)
In this section we are going to look at calling Classification Codes and expanding the data. Depending on how we wish to extract the data the following examples will demonstrate how to display the codes with a separator in one column or how to list each code in a separate row.
Codes in one column
First, we need to use a query to call the codes. Below is an example query, calling codes connected to referrals, converted to a table, and expanded.
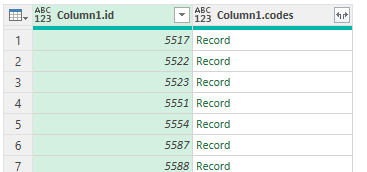
From here we can see that we are presented with a table that has nested records. These records may contain one or multiple Classification Codes. Clicking on a Record will then display the Classification Code table number with 'List', this is the codes associated with the original referral number that we drilled down on.
In its current format we are not able to make this data useful in a worksheet. The following steps will demonstrate how to load the data to a worksheet/report.
- Highlight the column that contains the records.
- On the ribbon at the top select the Transform tab.
- On the right-hand side select Expand and click ok on the dialog screen.
- Back on the Transform ribbon of power query select Extract Values.
- Select the required delimiter (character to separate the Classification Codes) and click OK.
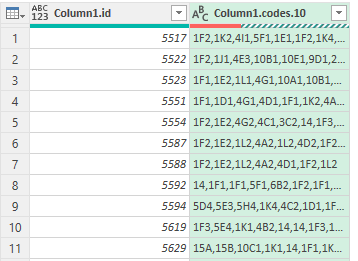
You will then find the column is now displaying the Classification Codes separated by the chosen delimiter.
The final query will look like this:
In Excel we can then use formulas to analyse the data.
The example below is counting the number of times the code 1K2 appears:
=COUNTIF(B:B,"*1K2*")
One code per row
First, we need to use a query to call the codes. Below is an example query, calling codes connected to referrals, converted to a table, and expanded.
From here we can see that we are presented with a table that has nested records. These records may contain one or multiple Classification Codes. Clicking on a Record will then display the Classification Code table number with 'List', this is the codes associated with the original referral number that we drilled down on.
In its current format we are not able to make this data useful in a worksheet. The following steps will demonstrate how to load the data to a worksheet/report.
- Highlight the column that contains the records.
- On the ribbon at the top select the Transform tab.
- On the right-hand side select Expand and click ok on the dialog screen.
- Again, select Expand to display the data.
You will then find each line will display the referral number and code. Each referral that has multiple codes will be repeated on a new line with the next code.
The final query will look like this:
In Excel we can then use formulas to analyse the data.
The example below is counting the number of times the code 1K2 appears:
=COUNTIF(B:B,"1K2")


