Difference between revisions of "Common Reports and FAQ's"
(→Number of Contacts) |
(→Data Extraction) |
||
| (One intermediate revision by one other user not shown) | |||
| Line 15: | Line 15: | ||
===Number of Referrals=== | ===Number of Referrals=== | ||
| − | Selecting to run the number of referrals report will extract the number of newly opened referrals within the timeframe and projects set on the | + | Selecting to run the number of referrals report will extract the number of newly opened referrals within the timeframe and projects set on the initial screen. Users extract this report to identify what new work has been opened within the timeframe and can then diverge more information about these referrals from within this report. |
| − | = | + | =Orgs & People Extract= |
| − | + | An Orgs & People Extract is a report mainly used for demographic data and producing client/staff/volunteer lists. The report does not cater for contacts and work done for clients but is set on criteria based information within the clients records; on section such as "general details or personal details". An example of a report you could do using the data extraction would be to identify how many active client records are male. | |
=Frequently Asked Question with Reporting= | =Frequently Asked Question with Reporting= | ||
Latest revision as of 13:32, 29 February 2024
There are numerous reports on the system that cater for all different sets of data entry. Finding the right report can be somewhat challenging for a new user not familiar with reporting requirments. The guide below will highlight the most common reports within the system and questions users have.
Contents
- 1 KPI Report Designer
- 2 Orgs & People Extract
- 3 Frequently Asked Question with Reporting
- 3.1 How to add more information to list of records in the report
- 3.2 How to amend and create your own fields to add to a report
- 3.3 How to add more data that is not selectable in field sets
- 3.4 Which report do you select?
- 3.5 The report doesn't give you the specific break down you require?
- 3.6 Is there a report to monitor what my users are doing on the system?
- 3.7 What the best way of viewing a breakdown of my clinics
- 3.8 What's the best report for observing change on outcomes?
- 3.9 Why is my report with a spreadsheet template not displaying any data?
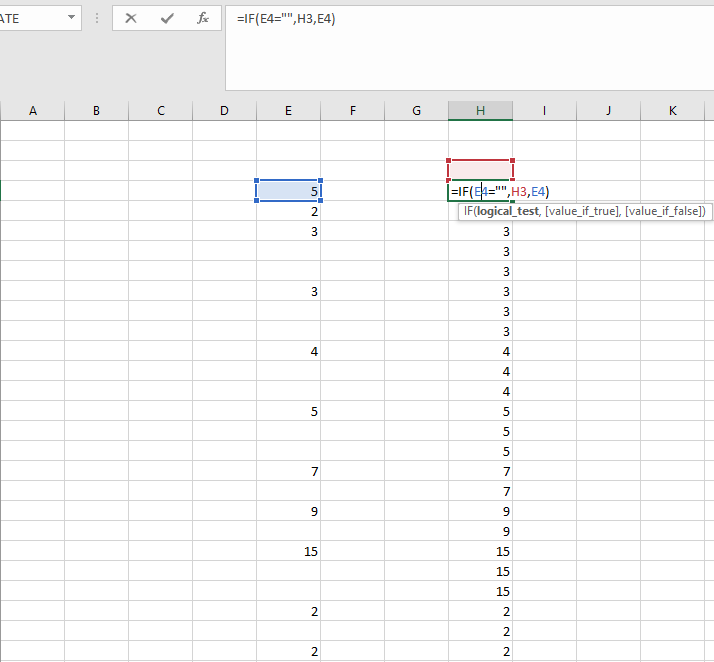
- 3.10 I've exported a report and I am getting blank lines, what can I do to remove these?
KPI Report Designer
The KPI report designer is the most used reporting tool and a core part of reporting on the system. The KPI report covers the largest expanse of modules on the system. This includes: Classification codes, Referrals & Contacts, Clubs & Clinics, Handyperson, Roster worker, Raw data, Volunteer information and more. The area of the system being looked at by the report is defined by the KPI reports tabs. Your first steps to running a KPI report are to select the date parameters you want the report to look at, and the projects you want to cover. For a detailed guide to running a KPI Report Designer, click the link. For some of the most common KPI reports, continue reading below.
Number of Person/Orgs Accessing Service In The Time Period
This report is useful to get a clear specification for the number of clients that have accessed specific projects/services within the selected date parameters. 'Accessed' refers to all the clients who have had a referral or contact in the given time period. This report will count unique people/orgs that have had a Referral, Update, Extra information or a Club clinic attendance recorded on the history page within the time period and project set on the initial screen. This is a common report for finding how many people your organisation has worked with during the time period.
Number of Contacts
This report will give all contacts in the time frame that would usually be displayed in the history of the client. This includes the first referral contact and any subsequent contacts for that referral in the requested date range. This report is very helpful for identifying all work being undertaken during a time period along with the time spent and other bits of useful data, providing this data is input.
Number of Referrals
Selecting to run the number of referrals report will extract the number of newly opened referrals within the timeframe and projects set on the initial screen. Users extract this report to identify what new work has been opened within the timeframe and can then diverge more information about these referrals from within this report.
Orgs & People Extract
An Orgs & People Extract is a report mainly used for demographic data and producing client/staff/volunteer lists. The report does not cater for contacts and work done for clients but is set on criteria based information within the clients records; on section such as "general details or personal details". An example of a report you could do using the data extraction would be to identify how many active client records are male.
Frequently Asked Question with Reporting
How to add more information to list of records in the report
When you have selected the right report and obtain the records you need, you may want to add more information about the records in the report, for example, their gender, ethnicity etc. In order to do this you need to select a field set to add onto the report. You can add this within the blue folder, see the image below.

How to amend and create your own fields to add to a report
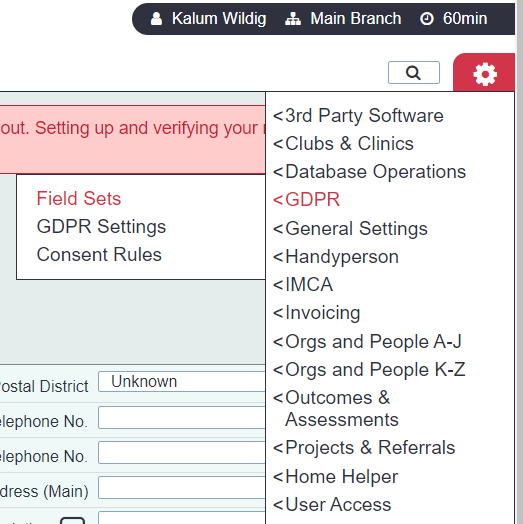
When adding a field set to a report, you may find it doesnt have all the data you need, or it may give you more data than you need. In this instance you may need to adjust your field set. In order to do this youll need to navigate to the field set page and either create a new field set to be used for the report, or amend an existing field set. The image below sets out where to go to do this.

How to add more data that is not selectable in field sets
The system has the extension database feature that allows users to create their own fields. In order to add this data to your report you can select to add this in the blue folder.

Which report do you select?
This is entirely dependant upon what you are trying to report on.
The report doesn't give you the specific break down you require?
As with the majority of information input onto the system, you are able to extract this into a report. Although you can customise data into a report, it may not always be in the layout or breakdown you specifically require. In these circumstances we recommend you adjust the data in an excel file, often using filtering, pivot tables or a formula.
Is there a report to monitor what my users are doing on the system?
Audit reports allow you to see what the user has input onto the system.
What the best way of viewing a breakdown of my clinics
The clinic monitoring report is a very powerful report for giving a breakdown of the people accessing and summary of the attendances during the time period the user is setting.
What's the best report for observing change on outcomes?
target comparison report will give a breakdown of first and most recent score in the time period
Why is my report with a spreadsheet template not displaying any data?
excel files exporting as csv's do not work with uploaded spreadsheet templates.
I've exported a report and I am getting blank lines, what can I do to remove these?
- Step 1: Copy column over into a new sheet.
- Step 2: On new sheet, in a new column input the formula =IF(first data of column =””, top row of column currently, first data of column) Image below: =IF(blue box = “”, red box, blue box)
- Step 3: Hit enter with calculations on and then copy new data column back into initial spreadsheet.
