Difference between revisions of "Tables (Excel)"
| Line 49: | Line 49: | ||
===Insert the table=== | ===Insert the table=== | ||
| − | At the top of the screen, on the " | + | At the top of the screen, on the "INSERT" tab, click "Table". |
[[File:TAPT_3.png]] | [[File:TAPT_3.png]] | ||
| Line 56: | Line 56: | ||
A box will now appear to enter the table data range, but because you have already selected the data before clicking the button, you don't need to make any alterations. You just need to make sure that "My table has headers" is ticked - this is so that Excel knows that the top line you've selected is column headings rather than actual data. Click "OK". | A box will now appear to enter the table data range, but because you have already selected the data before clicking the button, you don't need to make any alterations. You just need to make sure that "My table has headers" is ticked - this is so that Excel knows that the top line you've selected is column headings rather than actual data. Click "OK". | ||
| + | [[File:TAPT_4.png|border]] | ||
The data will now be formatted as a table. | The data will now be formatted as a table. | ||
| + | [[File:TAPT_5.png|border]] | ||
===Convert the table to a pivot table=== | ===Convert the table to a pivot table=== | ||
| + | Once the data is properly formatted as a table, it can be easily converted to a pivot table. Click anywhere in the table... | ||
| + | |||
| + | [[File:TAPT_6.png|border]] | ||
| + | |||
| + | |||
| + | ...then click the "Pivot Table" button on the "INSERT" tab. | ||
| + | |||
| + | [[File:TAPT_7.png|border]] | ||
| + | |||
| + | |||
| + | ====Pivot table data range==== | ||
| + | |||
| + | Another dialog box will now appear, prompting you to enter the pivot table data range. Because the data has already been formatted as a table, you shouldn't need to change anything; the data range will be set to that of your previously created table, and the pivot table will be placed in a new worksheet. Click "OK". | ||
| + | |||
| + | [[File:TAPT_8.png|border]] | ||
| + | |||
| + | |||
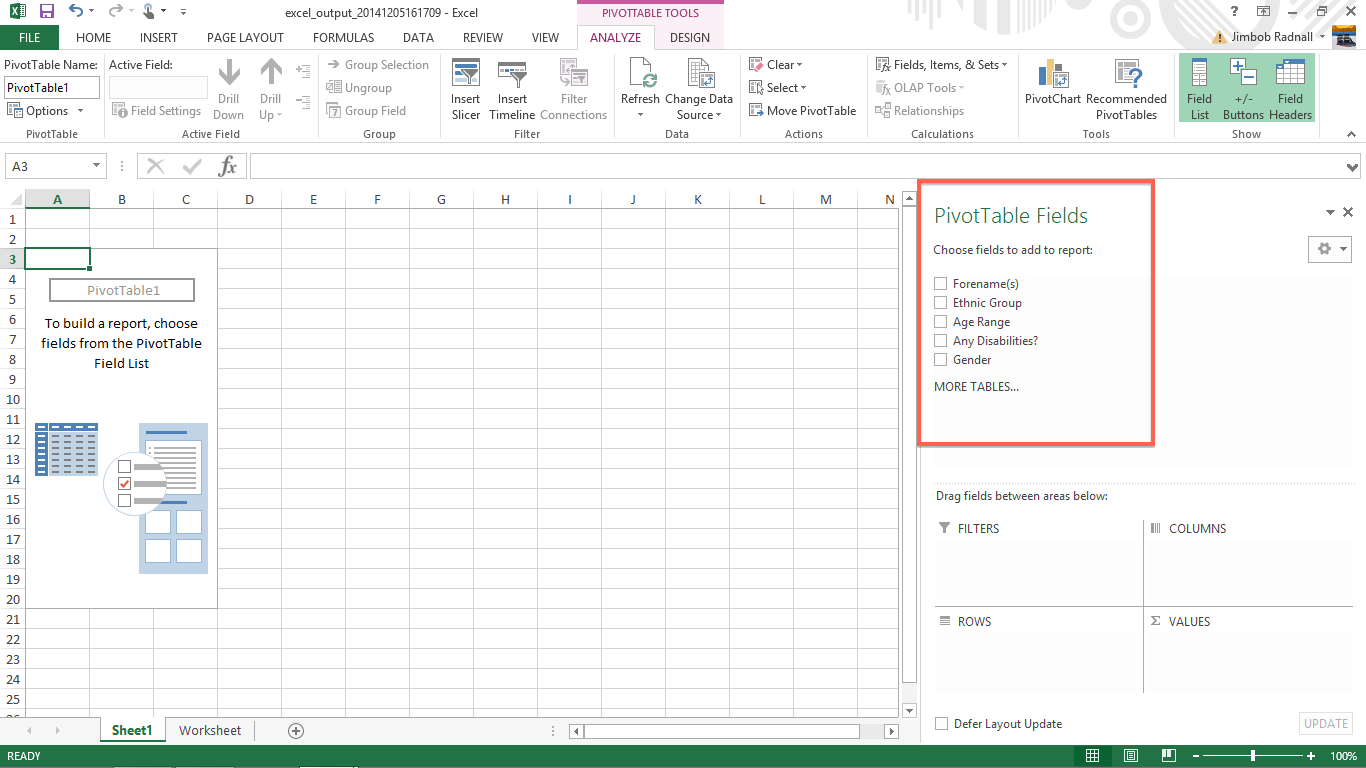
| + | You will now be taken to the pivot table. It will be blank, but your column headings should be displaying at the right hand side of the screen. | ||
| + | |||
| + | [[File:TAPT_9.png|border]] | ||
Revision as of 11:35, 8 December 2014
The reporting features of Charitylog are designed to allow users to extract data from their systems in Microsoft Excel format. Excel is industry standard software, and will allow you to do sorting of data, and create charts etc.
One of the most common questions we are asked in the support department is how to create a pivot table. This guide should help.
Contents
What is a pivot table?
A pivot table is a way of displaying information from a large set of data. Pivot tables are one of Excel's most powerful features, and they are surprisingly easy. With only a few steps, you can easily analyse Charitylog spreadsheet outputs using pivot tables.
Pivot tables allow you to count things, and display a count of one thing against something else.
To create a pivot table, it's helpful to first put your data into a (non-pivot) table. This guide uses Excel 2013 for screenshots, but other versions of Excel are very similar.
Extract data
First you will need to extract data from the system in Excel format. Information is most commonly exported from Data Extractions, the KPI Report Designer, or a mix of the two.
Once you have your spreadsheet open on your computer, you can begin work.
Define the data range for the table
You'll need to let Excel know which data you want to go into a table. For any spreadsheet exported from Charitylog, this is likely to be all of the data on the sheet.
- include column headings
- exclude any titles or descriptive text above the column headings
There are many ways to select cells on a spreadsheet but the simplest way is to do it manually.
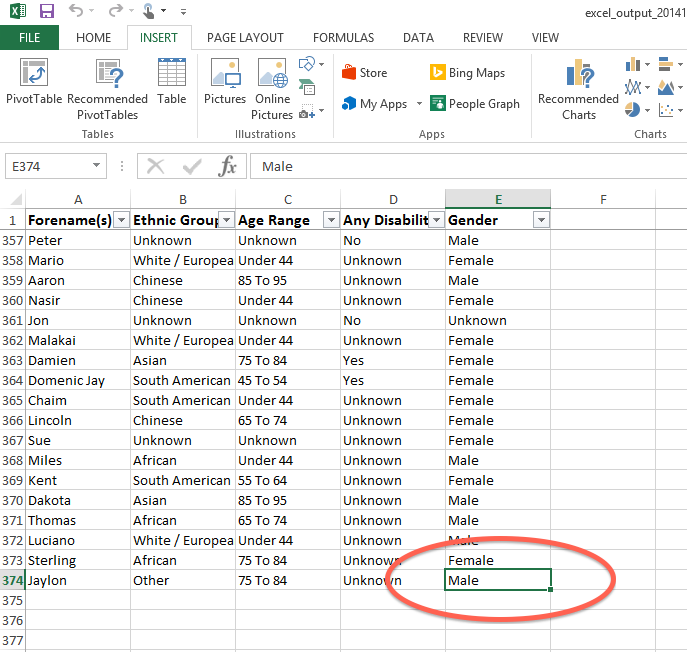
Select the last cell in the data
Scroll to the very bottom of the data, and as far right as the data goes. Remember that occasionally there might be a blank in the last cell (this is why it's good to start off by finding the end of the data first). Click on the cell so that it's highlighted.
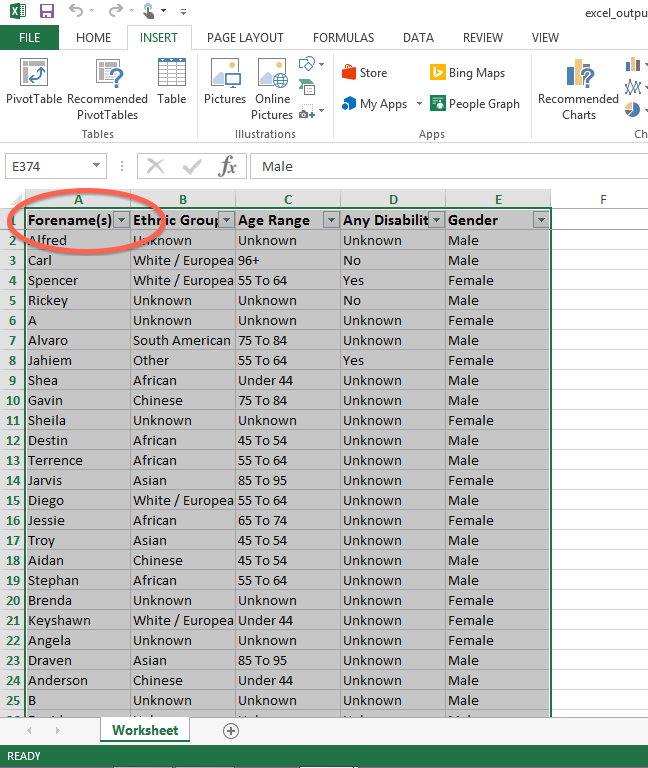
Select the first cell in the data
Now, without clicking any other cells in between, scroll to the top left of the spreadsheet. Hold the shift key and click in the first cell that you want to include. Remember that you need to include the column headers, but exclude any other text above them. Your data, and its column headers, should now be highlighted.
Insert the table
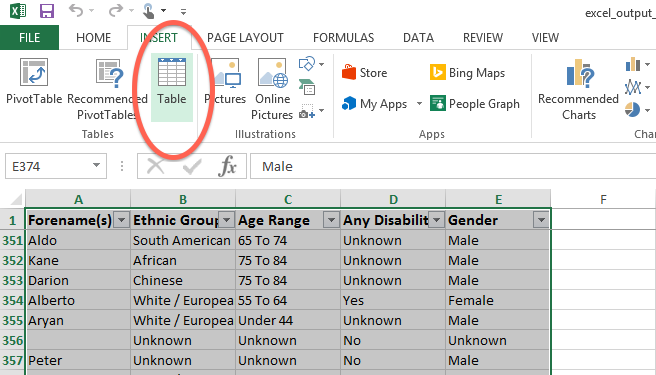
At the top of the screen, on the "INSERT" tab, click "Table".
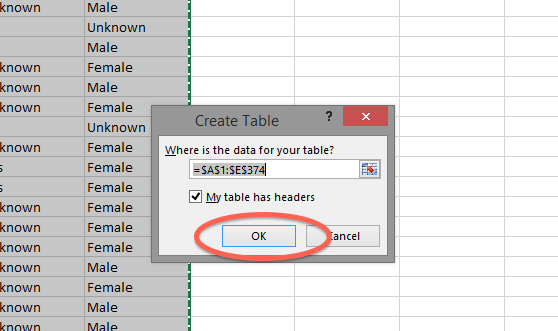
A box will now appear to enter the table data range, but because you have already selected the data before clicking the button, you don't need to make any alterations. You just need to make sure that "My table has headers" is ticked - this is so that Excel knows that the top line you've selected is column headings rather than actual data. Click "OK".
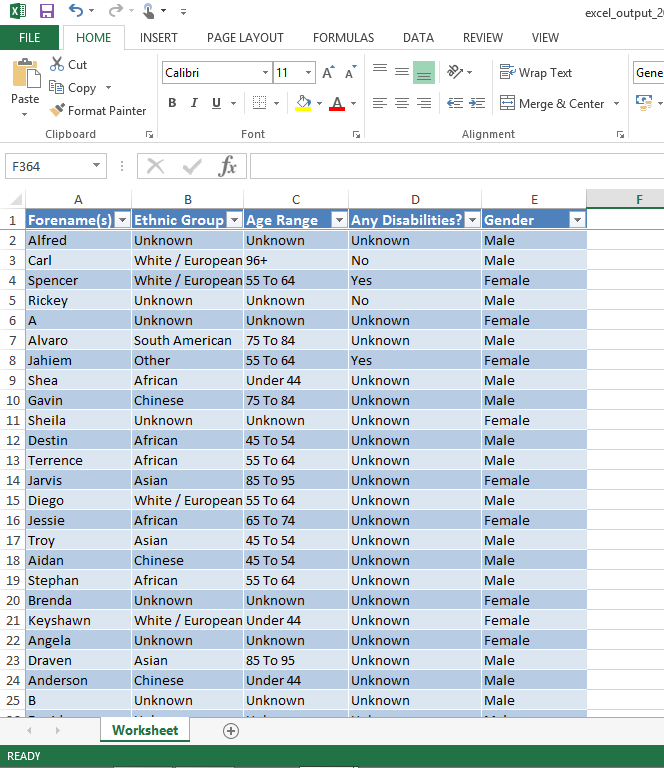
The data will now be formatted as a table.
Convert the table to a pivot table
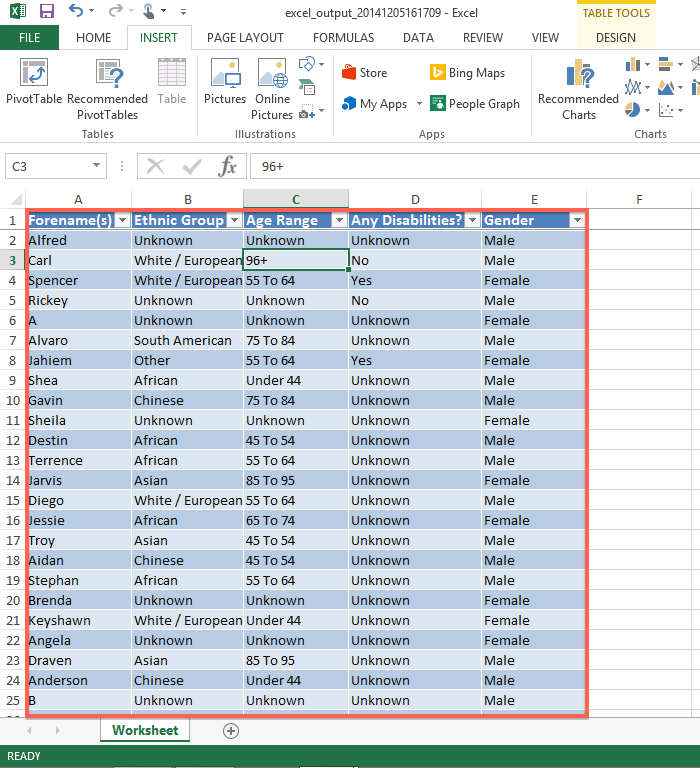
Once the data is properly formatted as a table, it can be easily converted to a pivot table. Click anywhere in the table...
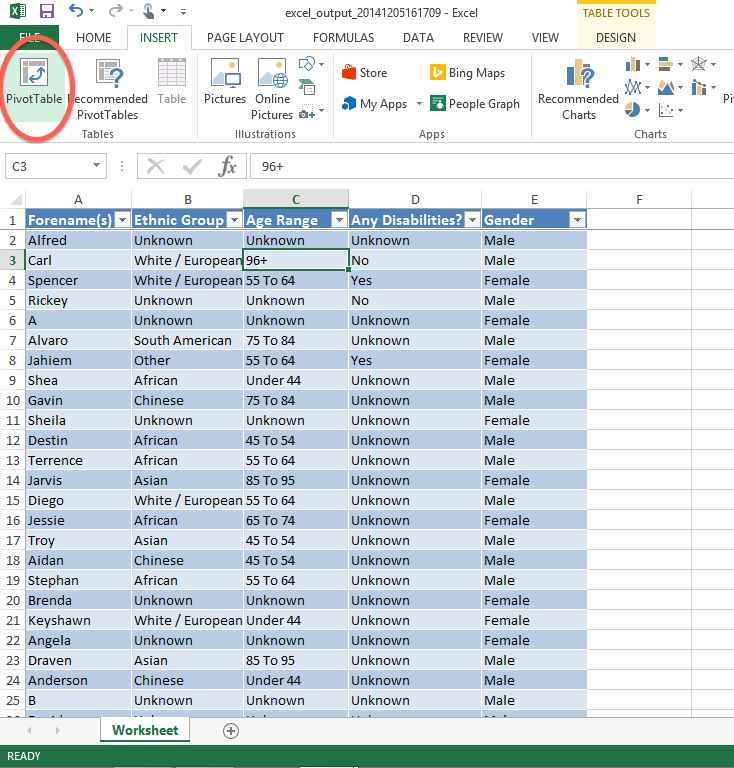
...then click the "Pivot Table" button on the "INSERT" tab.
Pivot table data range
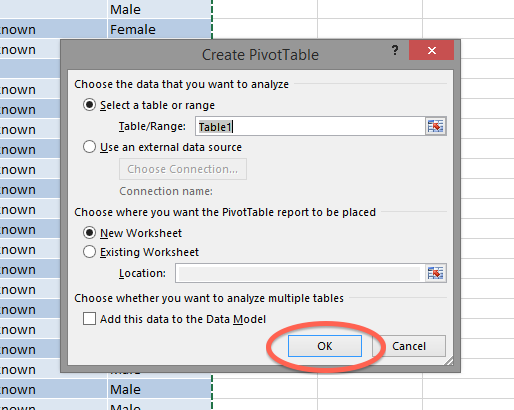
Another dialog box will now appear, prompting you to enter the pivot table data range. Because the data has already been formatted as a table, you shouldn't need to change anything; the data range will be set to that of your previously created table, and the pivot table will be placed in a new worksheet. Click "OK".
You will now be taken to the pivot table. It will be blank, but your column headings should be displaying at the right hand side of the screen.
(page in progress)
Rob Kay - manual author (talk) 16:41, 5 December 2014 (GMT)

