People Supported During Time Period
Contents
How do I report on all people supported during a set time period?
A common statistic you may wish to report on is how many people have been supported during a certain time period?
It is always best to handle this by asking the question "what do I mean by Support?". This is because the report criteria we select when running the report will be dependant on where we input the data.
Being considered 'supported' during a time period may mean:
- Having a referral during a set time period, or having a referral prior to the set time period, but a subsequent contact within it.
- Having a referral or contact during a set time period.
- Being recorded on a specific template stage during a set time period.
- Remaining on a specific template stage during a set time period.
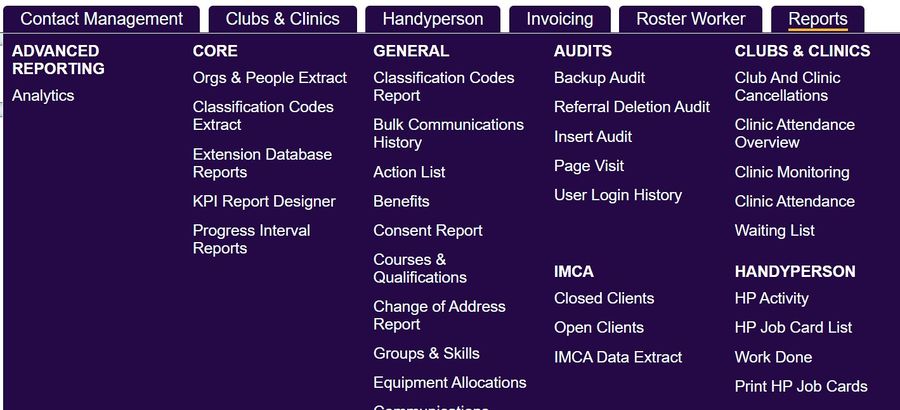
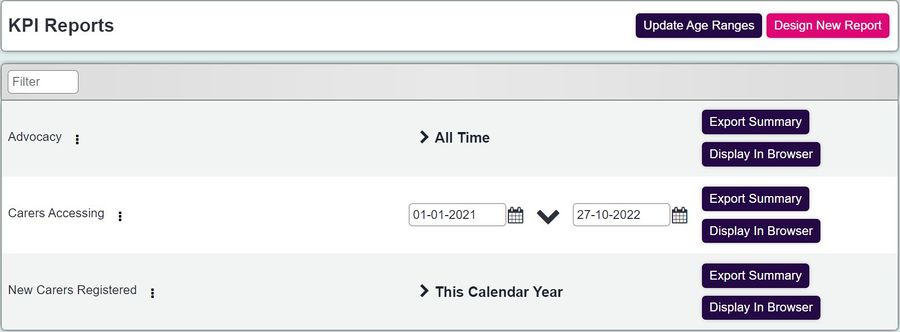
If the report you wish to run is not driven by template stages, it is recommended to start with a KPI report. All reporting options can be found under the reporting menu.
Once you've selected the KPI report designer, go to Design New Report in the top right hand corner of the screen.
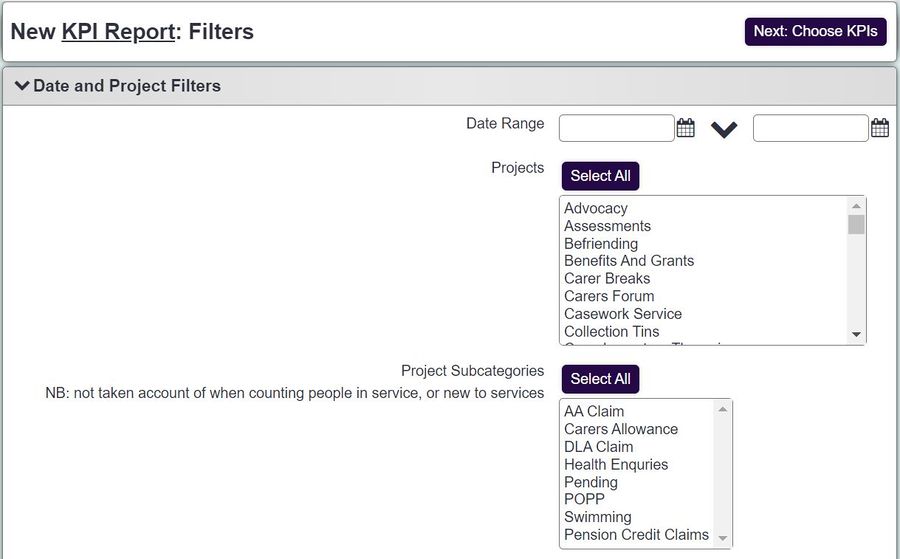
On the following page, select the dates and projects you need the report to cover.
From here, you need to select Continue to Next Step, where you can progress to choose your options.
Accessing Section
Depending on the terminology used to describe different types of organisations and people on your system, you will have a section within the KPI report designer for 'clients, organisations and referrers accessing'.
The help text within this report defines it as:
All Organisations and People for whom you have clicked Record a Contact, regardless of whether it's a new Referral or additional contact on an existing Referral.
Each Organisations or Person is only listed once, regardless of how many contacts they have had.
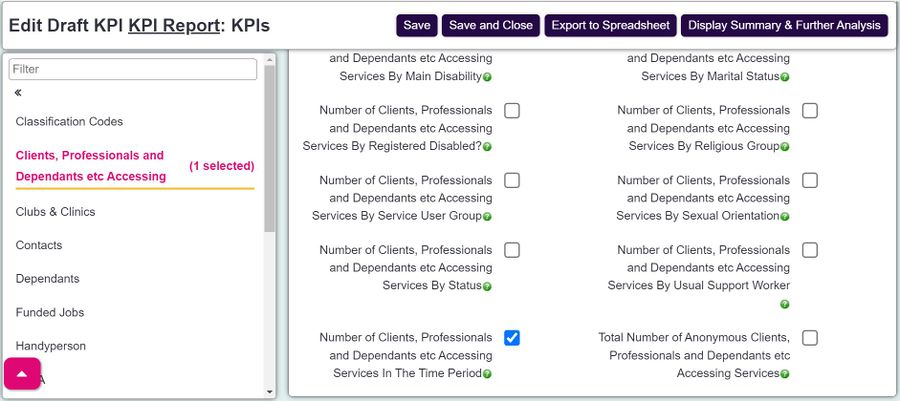
Ticking the option Number of Clients, Organisations and Referrers Accessing Service In The Time Period will provide you with all records that have had a referral or contact recorded during the time period. By selecting 'continue to next step', you can send this report to the blue folder to add on any extra criteria, such as related records.
The accessing tab also offers the option to break the report down further, showing more tick boxes which allow you to split the report by factors such as age range, marital status etc.
Referrals Section
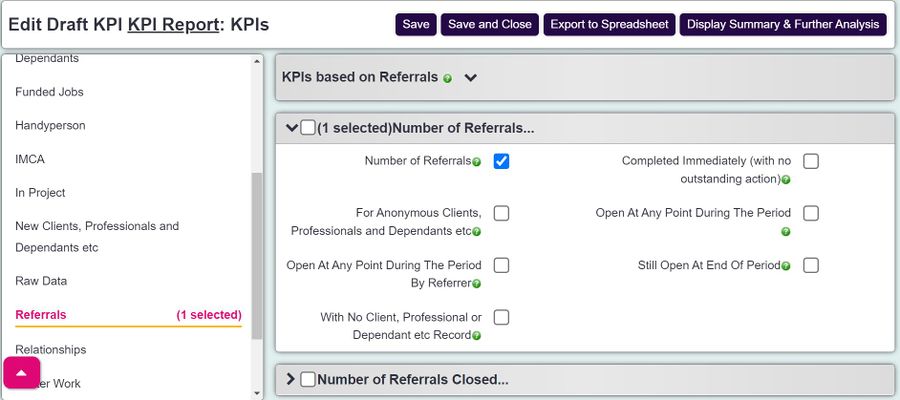
Depending on the terminology used on the system, you will have a section on the KPI report designer for 'referrals'. (This may be named something else, depending on your settings in cog > general settings > terminology.)
The options within this section will look at various referral linked information. However, to get an idea of how many people were referred during the time period you've selected, you can just tick the option for number of referrals.
The section offers you a further breakdown of this below, providing you with additional tick boxes should you wish to split this by demographic criteria. To export this to a spreadsheet, you can follow the usual steps of continuing to next step, adding on any additional data within the blue folder, and then exporting to excel.
Hover over or select the green question marks to get a more detailed description of the report.
Contacts Section
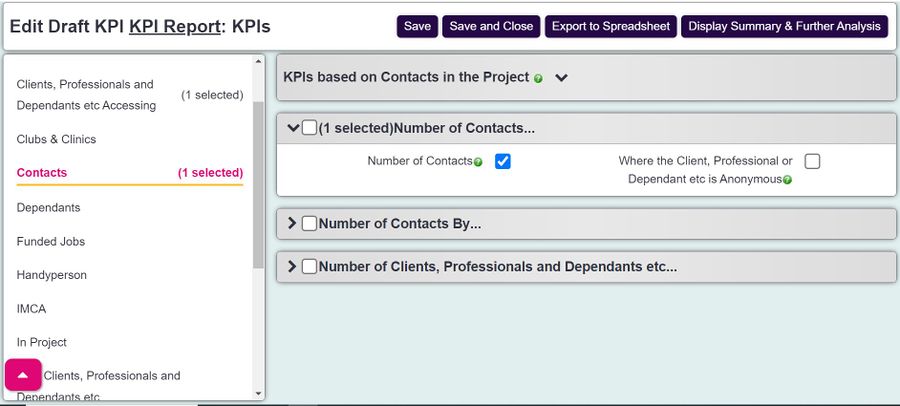
You will find a 'contacts' section on the KPI report designer. This section is designated to looking at individual contacts.
The help text within this report defines it as:
Numbers of contacts with or on behalf of Organisations and People - this includes the first Referral contact and any subsequent contacts for that Referral in the requested date range.
You will be provided with the option of a number of contacts report. Below this, you will have the ability to report on 'Number of Contacts By...' which allows you to further break down the report.
Reporting on stages
You may define receiving support as having recorded specific template stages. This means, if a certain stage was applied against the referral during the time period, the person may be considered as having received support.
The Progress Interval Report is built to specifically look at referral stages. You can find the Progress Interval Report under the core title in the reporting menu.
To see a detailed explanation about using the progress interval report, click here
Adding additional data
Part of looking at people supported during a time period may involve additional data that is linked in with the supported person. This might be related records, Club and Clinic memberships, or Extension Database information.
The Blue Folder Lookup is designed to allow you to add this information to reports. You will see four buttons at the top of the KPI report designer. These are:
- Save - Save and Close - Export to Spreadsheet - Display Summary & Further Analysis
By selecting 'Display Summary & Further Analysis', you will be presented with your report results. This will be in the form of a blue folder icon, and an Excel icon.
Opening up the blue folder icon will display you with the options to add additional data to the report.
- Add Field Set Looks at the standard fields selected in the field sets created via cog > GDPR > field sets. Applying a field set to the report will export columns with the chosen fields, containing data relating to the org/person record on the report.
- Add Org/People Linked Records Looks at a selection of Org/People related data. Such as Extension databases, links, related records, consent, and Clubs and Clinics. A useful option within this box is the ability to add relationships. This will add a row for the related records in Excel.
- Add Referral-linked Records Looks at a selection of referral related data. This includes referral linked extension databases, additional referral information and outcome data.
For further information on the blue folder, click here.
