View Dashboard
Contents
Introduction
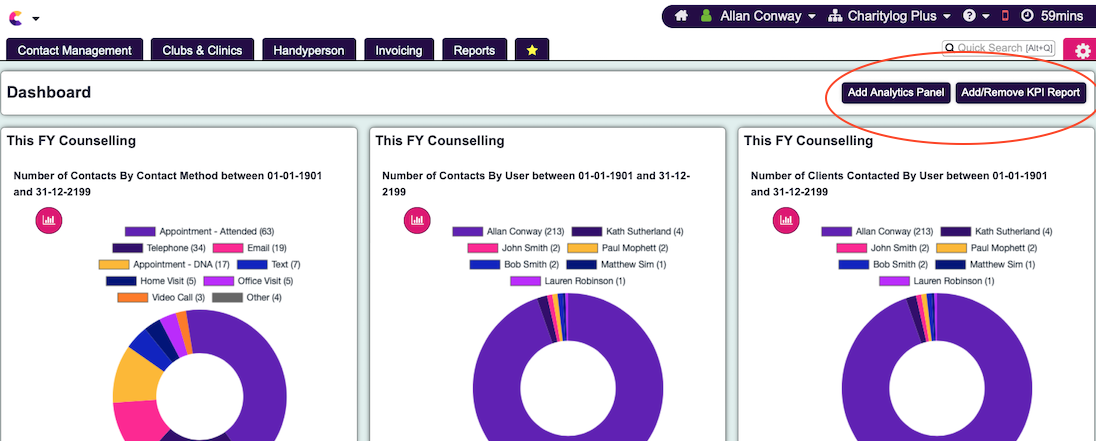
The dashboard displays the charts from the saved Analytics and from KPI Report Designer. To open Dashboard, click on your username at the top right of the screen, then click on View My Dashboard. This will display live results as at the time of going to the page, which can simply be refreshed by pressing the F5 key on the keyboard. The dashboard is built by adding report panels from either pre-saved Analytics or KPI Report. The below video explains how it can be set up.
Adding reports
Once open you can see 2 options to add report panels. You can either Add Analytics Panel or Add/Remove KPI Report. It is important to note that the dashboard is essentially fed by a report that already exist. It will just display an existing report that has already been set up. You will need to ensure you have relevant reports created in either Analytics or KPI Report Designer.
Adding Analytics Reports
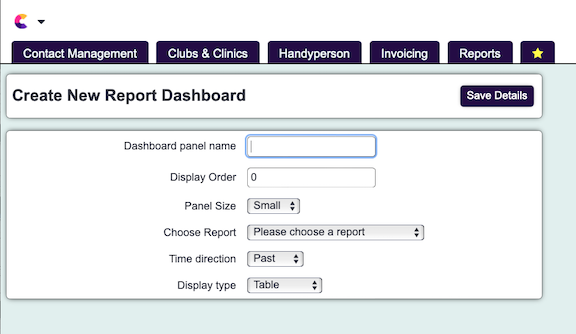
Once you click on "Add new Analytics Panel' you will then be asked to select which report you would like to add and then specify the below parameters. It is advisable to keep all panels as Large to ensure they display correctly.
- Dashboard panel name - The name displayed on the report panel.
- Display Order - The order that the panel will be displayed on the dashboard.
- Panel Size - You can select Small (allows more than one panel per display line) or large (one panel across the display line)
- Choose Report - Select which saved analytics report you wish to use for the displayed table/chart.
- Number of Years/Months/Days to report on - For reports that are based of time you can specify how many units (days, months or years) to display.
- Time Direction - For some reports they may be based on actions in the past or future, select Past or Future.
- Display Type - You can display a table, line chart, bar chart, pie chart.
Click the 'Save Details' button to add the panel to the dashboard.
Adding KPI Reports
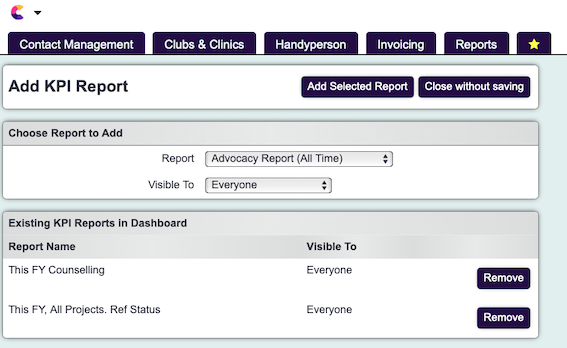
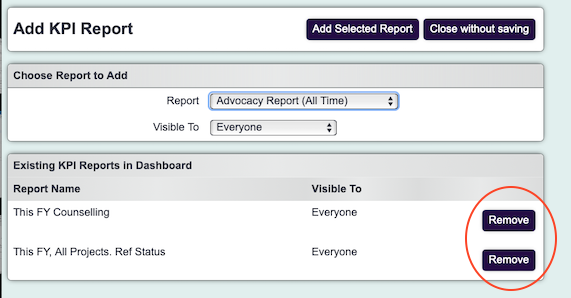
First you will need to select which report will be displayed. This will select from a list of existing, saved KPI reports. Then, you can decide the visibility of these reports which can be either:
- Everyone - meaning everyone accessing the dashboard will see it
- Only people in your group - it will show which user group you are in, and restrict visibility to those in the same group
- Just Me - only you will see this report
Removing Panels
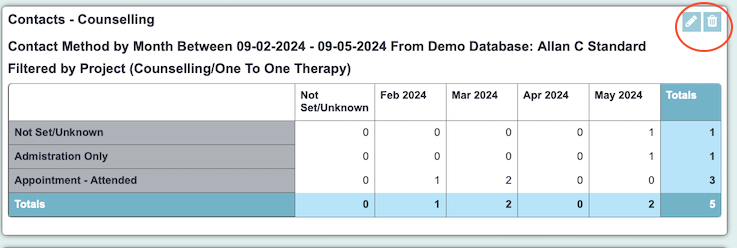
To remove an analytics panel simply click on the Delete icon which is displayed at the top right corner of the panel (as seen below). Note this will not delete the actual report, it will just remove it from the Dashboard.
To remove a KPI Panel, click on Add/Remove KPI Report from the main Dashboard screen. You will then see a list of the reports displayed so you can just click on remove. Again, this will not delete the actual report, it will just remove it from the Dashboard.

