Difference between revisions of "Reports (Administrator guide)"
(→Step 2: select items to print) |
|||
| Line 53: | Line 53: | ||
====Step 2: select items to print==== | ====Step 2: select items to print==== | ||
| − | The screen you will now see has a series of tabs, with many tick boxes displayed for each tab. The tabs group the output options, and each output option (usually) is one "thing by thing" - "new referrals by district" being an example. The tabs are as follows. | + | The screen you will now see has a series of tabs, with many tick boxes displayed for each tab. (section of page shown) |
| + | |||
| + | |||
| + | [[File:reports_6.png|border]] | ||
| + | |||
| + | |||
| + | The tabs group the output options, and each output option (usually) is one "thing by thing" - "new referrals by district" being an example. The tabs are as follows. | ||
=====Raw Data tab===== | =====Raw Data tab===== | ||
Revision as of 10:12, 18 May 2013
About Charitylog's reporting features
For most organisations, the ability to produce reports from Charitylog is probably the most important aspect of the whole system. Charitylog provides many ways to get the data that users enter on the system back out again. The most obvious ones are the preset reports, which are designed for a specific purpose and cannot be customised by the user. These are scattered through the system - for example, reports for the Support Worker module are usually accessible from the same submenu as the rest of the module's functionality. Some of these simple reports are also in the "Reports" submenu, such as the Office Reports, and these are dealt with in the end user manual: Reports.
The rest of these reports are dealt with together with the activity they relate to, so details of the Support Worker reports are in the Administrator guide to the Support Worker module, and so on. This chapter deals with the customisable reports, which are where the real power of Charitylog's reporting lies. This chapter looks mainly at three features: KPI Reports, Data Extraction and blue folder lookups.
Contents
- 1 About Charitylog's reporting features
- 2 Action List
- 3 Benefits Report
- 4 Data Extraction/Mail Merge
- 5 Extension Database Reports
- 6 IMCA Reports
- 7 KPI Report Designer
- 8 Office reports
- 9 Print Job Cards
- 10 Referral Reports
- 11 Timesheets
- 12 Outcome Reports
- 13 Support Worker Reports
- 14 Club & Clinic Reports
- 15 Handyperson Reports
- 16 Volunteering Reports
- 17 Progress Interval Reports
The KPI Report Designer
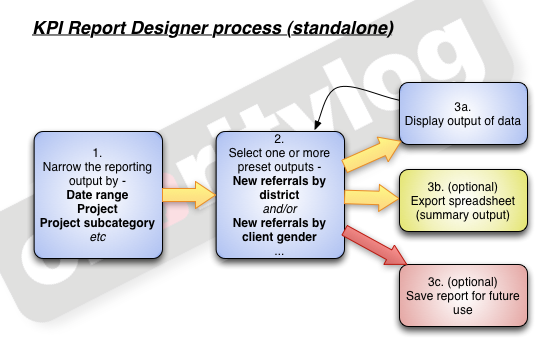
The KPI (Key Performance Indicator) Report Designer allows you to see "certain things by another thing" - for example, "number of new referrals by district". This really means you are asking the system, "show me all of the new referrals, along with the district of the relevant clients, and group the results together by district". The KPI Report Designer takes a 3-step approach, as shown.
Step 1: narrow the reporting output
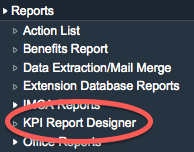
Open the "Reports" submenu, then click on the "KPI Report Designer" menu item.
This will take you to the first step of the KPI Report Designer.
General Report Criteria
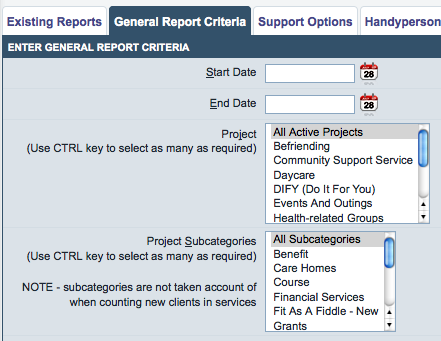
When creating a report you need to be able to narrow it by some fundamentals, otherwise all of the reports produced would be huge (if every report looked at all of your data). Throughout the Charitylog system you are able to narrow your selections by two fundamental qualities: a date range, and a Project. The same applies here - the "General Report Criteria" tab lets you choose a date range and the Project(s) you want to look at. You can also narrow the report further by Project Subcategory.
Support Options
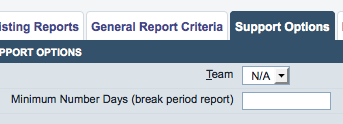
There are also some options specific to the Support Worker module, and these are shown on the Support Options tab.
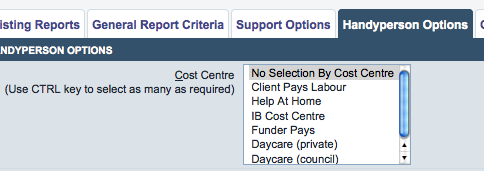
Handyperson Options
Handyperson module-specific items are shown on this tab.
Step 2: select items to print
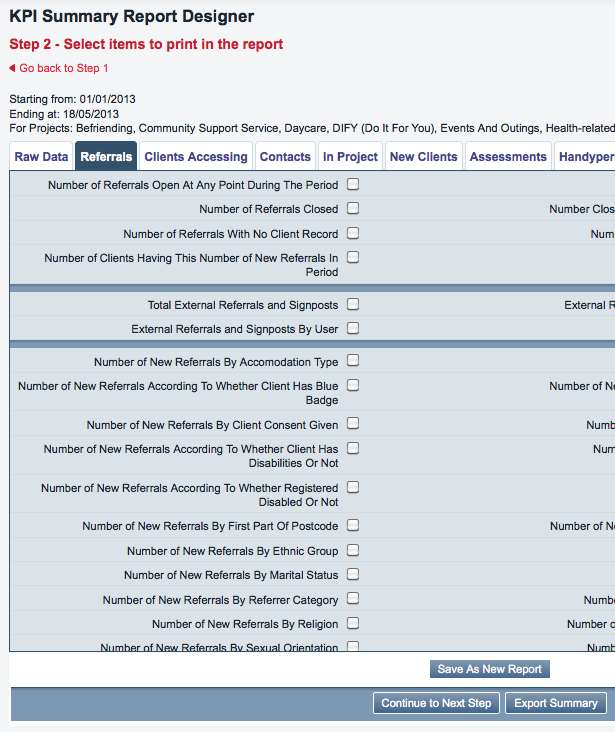
The screen you will now see has a series of tabs, with many tick boxes displayed for each tab. (section of page shown)
The tabs group the output options, and each output option (usually) is one "thing by thing" - "new referrals by district" being an example. The tabs are as follows.
Raw Data tab
General data extractions - so these are not something by something else - rather, they will be a full data spreadsheet, which you can do with as you wish.
Referrals tab
These are to do with the Referrals on your system - the available items are mainly focused on new referrals, but there are also items for closed referrals and external referrals.
Clients Accessing tab
These items focus on the clients themselves, so even if a client has several referrals ongoing, they will only be counted once.
Contacts tab
These items focus on contacts with clients, so one client who has been into your office for four visits would be counted four times, etc.
In Project tab
Clients In Project items and Termination-specific items. For more information on the concept of "Clients In Project", see the Projects chapter.
New Client tab
Items relating to clients that were new to the selected Projects in the time period.
Assessments tab
Items relating to Assessments.
Handyperson tab
Items relating to the Handyperson module.
Clubs & Clinics tab
Items relating to Clubs and Clinics.
Support tab
Items relating to the Support Worker module.

